How does it work?
The basic idea is that the debugged program generates events that describe its activity, and sends them to a database. Then the debugger frontend queries the database according to the actions of the programmer.
Architecture
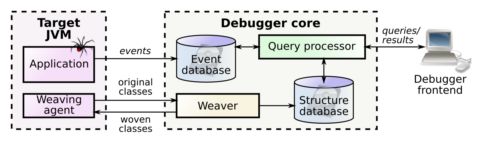
In TOD the debugged program, the event database and the debugger frontend each run in a separate process. The target JVM that runs the debugged program is equipped with a weaving agent that hooks into the Java class loading mechanism so that it can weave the classes of the debugged programs: instructions that generate events and send them to the database are inserted before or after specific instructions of the program. Thus when the code of the instrumented classes is executed, events are sent to the database.
The weaving takes places in the same process that hosts the event database: the original bytecode of classes is sent to the weaver, which appropriately modifies the bytecode and then sends it back to the target JVM (note that the target JVM caches the weaved versions of classes so as to reduce the class loading time). The weaver is also in charge of maintaining a structure database that registers the static structure of the debugged programs (ie. the structure of classes, the signature of methods, etc.).
As soon as events start flowing into the database, the programmer can start a debugging session using the debugger frontend, which respond to user interaction by making the appropriate queries against the event and structure database. For more information on the way in which the user interacts with the debugger refer to the .
Distributed event database
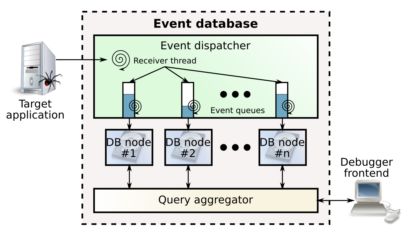
The event database of TOD is designed to be distributed: it scales very well when deployed on several machines. In our tests, we obtained a sustained recording throughput of 55kEv/s (thousand events per second) on a single machine, and 470kEv/s on a cluster of 10 machines.
© 2007 Guillaume Pothier | Generated by webgen | Design by Andreas Viklund.