User’s manual
Contents:
Running your program
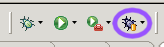
Running your program under TOD is straightforward: just use the TOD launch button instead of the usual Run or Debug launch buttons:
The program will start and its history will be recorded. Note that the execution of the program is slower with TOD (see the faq). Do not set breakpoints! Although you can set breakpoints, the idea of TOD is that you don’t need them. Instead, just let your program execute until the bug occurs, and then use the trace navigator to find out what happened.
The trace navigator
The trace navigator is the main interface to TOD. To open the trace navigator go to Window/Show view/Other… and then select “Trace Navigator” in the TOD category.
The trace navigator works like a web browser, displaying different types of pages and letting you switch between pages using hyperlinks and back and forward buttons. The available pages are the following:
Threads page
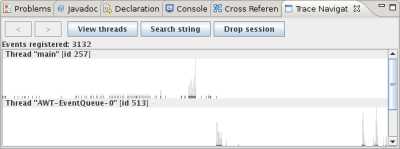
This page shows an overview of the activity of your program. Each horizontal band represents the “electrocardiogram” of a thread, or the evolution of its activity over time. This page can be accessed at any time by clicking the “View threads” button. Clicking on any thread brings the corresponding control flow page.
Control flow page
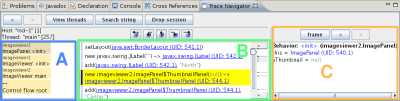
The control flow page shows execution events in context. The center pane (B) displays all the events that occurred during the execution of the current method; the currently selected event is highlighted in yellow. The left pane (A) shows the call stack, with the most recent call at the top. The right pane© shows a reconstitution of the stack frame as it was when the selected event was executed.
The buttons above the center pane permit to simulate step-by-step execution forward or backward; the up button in the center goes up one level, selecting the call event for the current method.
Event list page
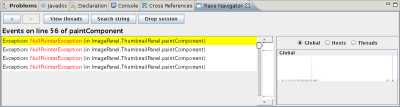
This page shows a list of events matching a certain condition. For instance, all the events that occurred at a particular source code line (using the gutter menu). Double-clicking an event in the list will bring the corresponding control flow page.
The left part of the page shows the activity of the whole program, and the event that is selected in the right part is highlighted in blue in the left part.
Object history page
String search page
Where to start
The first thing to do is to find an entry point into the trace. There are several ways to do it, which we describe below.
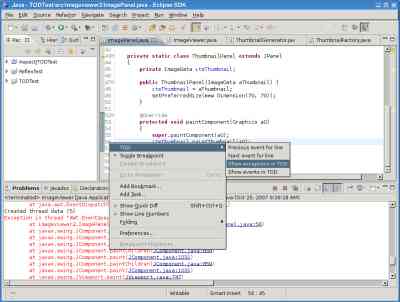
Using the TOD gutter menu
The TOD gutter menu can be accessed by right-clicking the gutter (right margin) in the Java editor. It provides two ways to enter the execution trace: “Show events in TOD” and “Show exceptions in TOD”. These two commands are very similar: the first one show a list of all the events that occurred on the current line, and the second one restricts this list to exception event. The “Show events in TOD” command is TOD’s equivalent of breakpoints: the first event in the list of the events that occurred on a particular line corresponds to the point a breakpoint-based debugger would have stopped if you had placed a breakpoint on this line. If your program thrown an exception, the easiest way to enter the execution trace is to use “Show exceptions in TOD” on the line where the exception was thrown.
Performing either command will bring the Trace Navigator, showing all the events that were recorded for the current line:
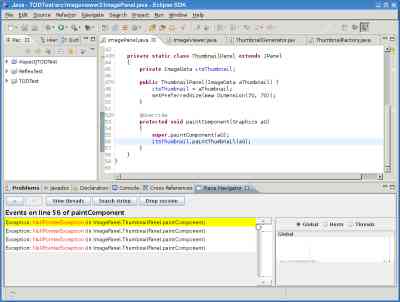
You can see the context in which a particular event occurred by double-clicking it. This will bring the control flow view:
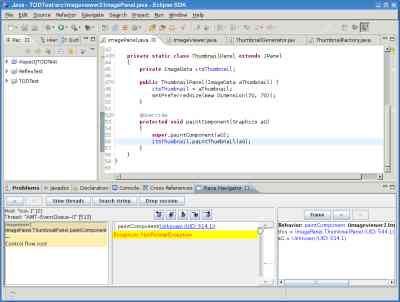
The leftmost part is the call stack: it shows which methods were on the call stack at the time the current event occurred. The middle part is a list of the events that occurred in the current method. The rightmost part is a reconstitution of the stack frame as it was when the current event occurred.
TOD options
The behavior of TOD can be altered by options that are specified in the launch properties dialog:

Currently only a few options among those available are useful for the user (many are only used during the development of TOD itself):
Scope – trace filter
This option defines the instrumentation scope, ie. the classes whose activity is recorded during the debugging session. Limiting the scope to carefully selected portions of the program permits to reduce both the overhead on the debugged program and the load of the event database. The default value of this option is:
[-java.** -javax.** -sun.** -com.sun.** -org.ietf.jgss.**
-org.omg.** -org.w3c.** -org.xml.**]
which means that classes from the JDK are excluded from the scope. To exclude more classes, simply add them to the list (preceded by a minus sign); to specify a full package with its subpackages use the ** wildcard. To exclude everything except specific classes, use something like this:
[+my.package.** +my.other.package.**]
TOD and AspectJ
TOD provides specific features for debugging AspectJ programs (see Extending Omniscient Debugging to Support Aspect-Oriented Programming). In order to enable those features, the debugged program must be compiled with a patched version of abc, which you can download here. This compiler tags each bytecode of the program with information that indicates the purpose of this bytecode.
Compile your program with abc to generate the tagged classes:
java -jar abc-complete.jar \
  -sourceroots <your source path> \
  -d <your output directory> \
  -tag-instructions \
  -around-inlining:off -before-after-inlining:off \
  -ext zz.abc.sourceloc
Once your program has been compiled, you must tell Eclipse to use the tagged classes instead of those compiled by AJDT. You must modify the classpath of the launch configuration you use to run your program: remove the default entries and add the folder containing the tagged class as a new User entry. You must also add abc-runtime.jar to the classpath.
Then you must tell TOD to actually use the tags contained in the classes. In the TOD option tab of the launch configuration, enable the “Include aspect info” option.
© 2007 Guillaume Pothier | Generated by webgen | Design by Andreas Viklund.